.webp)


.jpeg)
Giving your dev team the freedom to run cloud environments has never been easier, thanks to IaC and env0’s environments-as-a-service platform. Your developers will love the freedom of self-service cloud environments, your infrastructure team will love the governance, but how will your CFO react?
At env0, one of our main goals is keeping the balance between freedom and governance. While part of that is purely technical (like following conventions, and ensuring security), cost management is also a big part. Developers should stay happy and focused on delivering quality features, while managers have the right tools to understand and manage the costs.
We already utilize the power of Infrastructure-as-code to automatically tag your environments and provide reporting on the actual costs of your environments over the last seven days, but cost is never one figure - there’s a story behind it. That’s why we are introducing a brand new Cost Over Time display into the env0 platform.
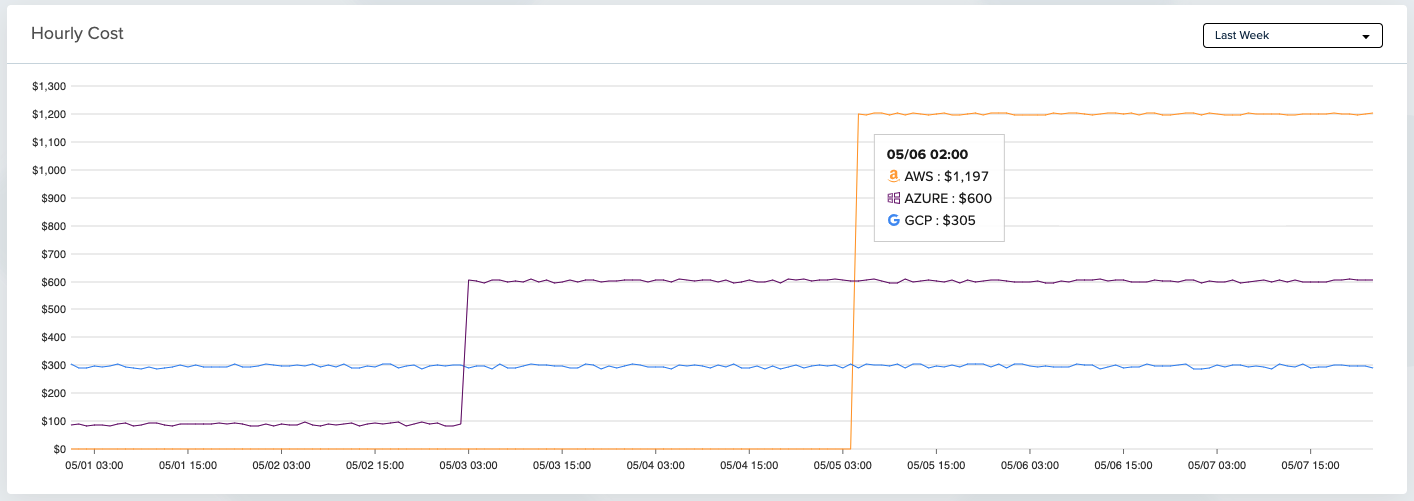
Costs over time
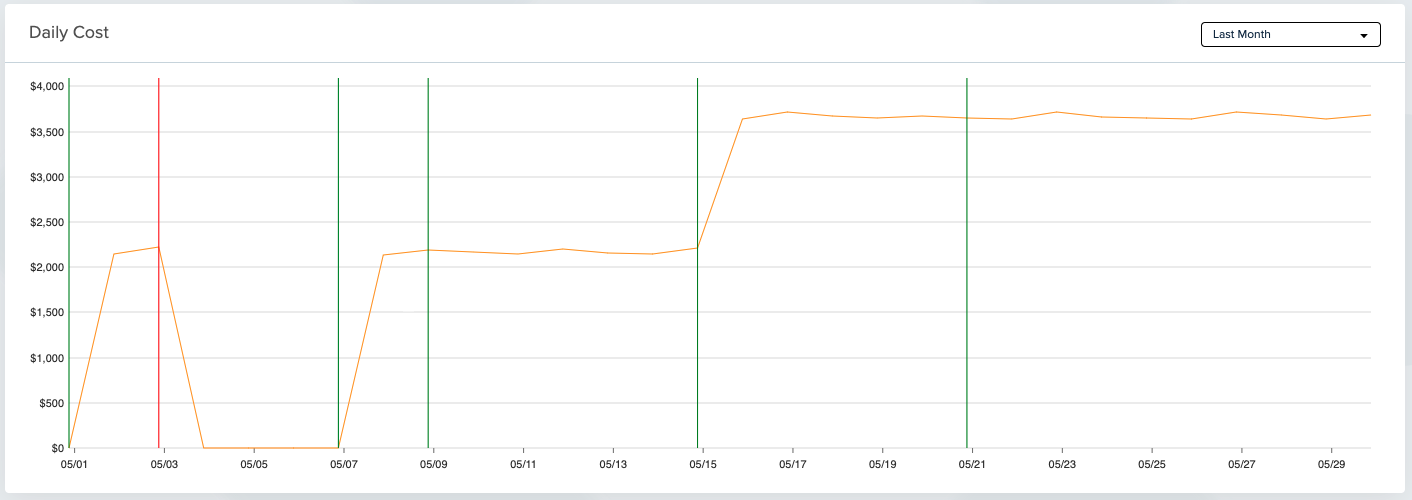
Cost charts provide visibility into your environment’s costs, letting you see how costs changed over the last day, week, month or even quarter. Vertical lines represent changes to your infrastructure - helping you find deployments that affected cost.
Reporting that’s easy to read
Are your “compute instances” or “load balancers” costing a fortune in region “eu-south-3” ? What does that even mean in the context of your actual business and how can you translate these technical terms into action items?
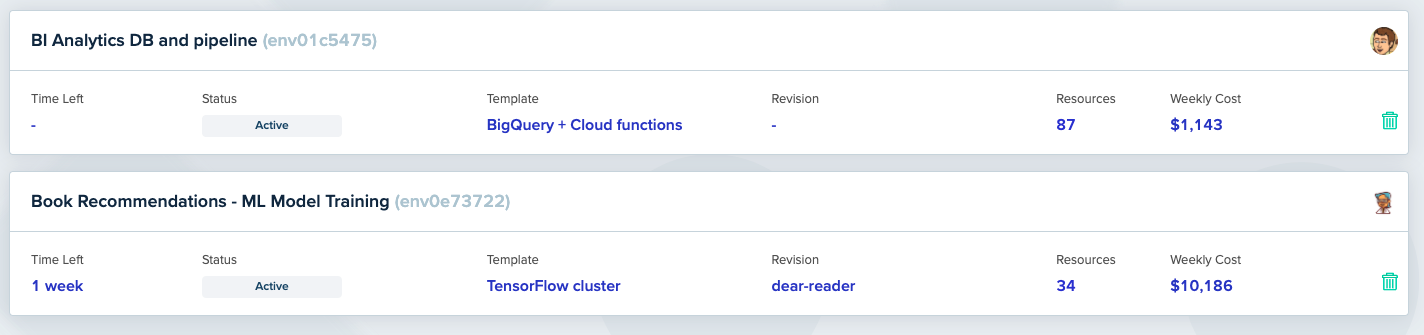
When managing software development, we don’t think in “regions” or “resources”, we think in projects and teams. With env0, the costs you see are for a specific environment, so you can understand exactly who is using this environment, and what it is used for.
Don’t stop at “how much?” - dare to ask “why?”
Since env0 manages your infrastructure, our cost charts will also show when changes to your infrastructure were made, so you can understand the reasons for changes in expenditure. Cloud cost suddenly went up last week? With the new cost charts it’s easy to see which deploy happened at the same time.
This information will help you make smarter decisions, so you don’t have to settle for seeing costs increased - you can understand the root-cause - and how to fix it.
Unparalleled multi-cloud support
Do your environments run on multiple cloud providers? We got you.
Multi-cloud deployments are becoming more widespread. You might have multi-cloud workloads for redundancy, or just one service cherry-picked from a different provider to complete that exact feature set you require.
Monitoring cost over different providers is still a challenge for many devops teams, but don’t despair! env0’s new cost charts will display the cost per cloud provider, helping you understand where you spend the most.
Now that you’ve seen the power env0’s cost reporting can bring, feel free to try it out for yourself. If you’d like to get a deeper look into env0 - feel free to reach out or schedule a demo. We look forward to hearing from you!